 June
This is a sample project using public market data: Nike (NKE) and SPDR S&P 500 ETF (SPY) prices, plus T-bill rates, January 2016 to October 2026. It is not paid client work.
What I did
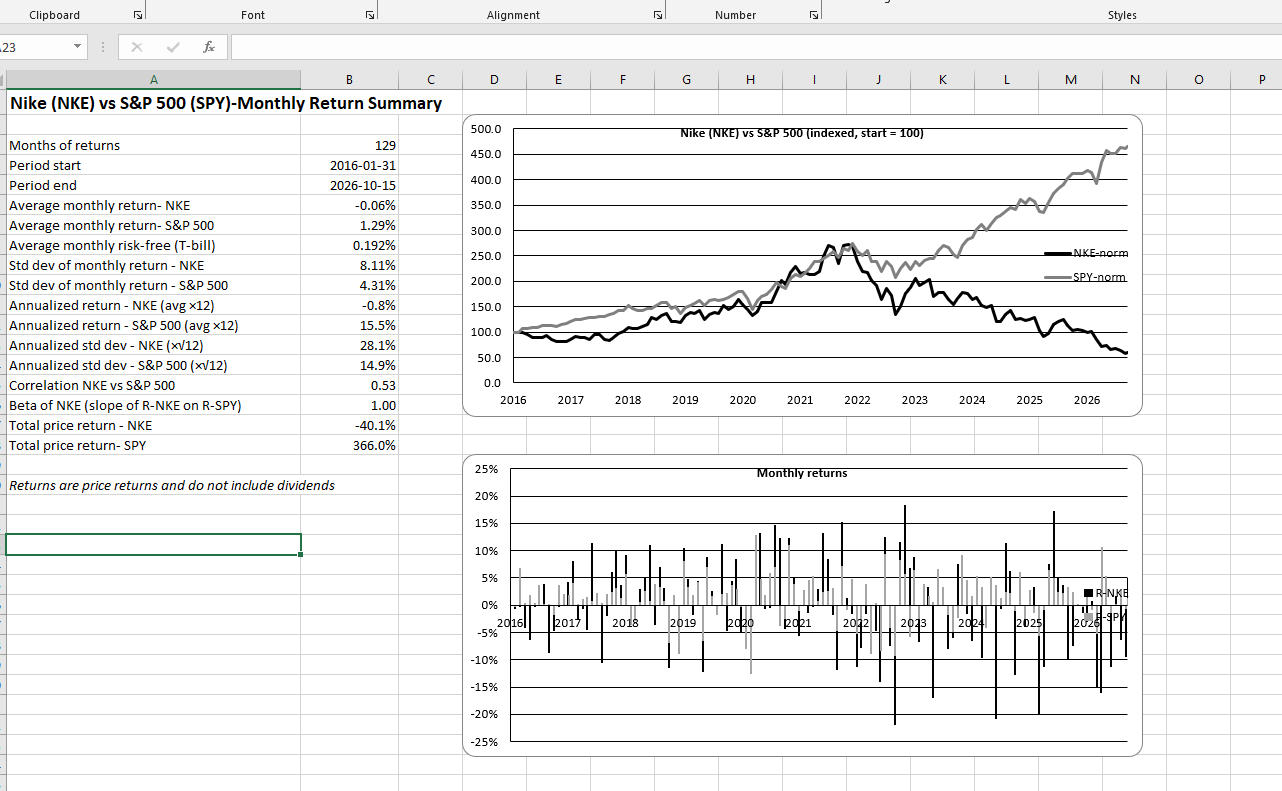
Calculated monthly and quarterly returns, normalised both series to 100, then worked out averages, volatility, correlation and Nike's beta, with a sheet explaining the benchmark choice and sources.
- 1Collected monthly and quarterly NKE and SPY prices and T-bill rates
- 2Calculated period returns and a risk-free rate for each period
- 3Normalised both price series to 100 to compare growth side by side
- 4Built summary statistics: averages, standard deviation, annualised figures, correlation and beta
- 5Documented why the S&P 500 is the right benchmark and listed the sources
The work
Key findings
- Total price return: Nike -40.1%, SPY +366.0% (monthly data, 129 months)
- Annualised volatility: Nike 28.1% vs SPY 14.9%, so Nike moved about twice as much as the market
- Beta of 1.00 (monthly) and 1.10 (quarterly), with a correlation of about 0.53 to 0.56
Tools
Excel
Delivered
Two Excel workbooks (monthly and quarterly) with data, summary and sources sheets
Result
Nike's price fell about 40% over the period while SPY rose about 366%, with roughly twice the market's volatility and a beta close to 1.