 June
This is a sample project using sample survey dataset of 190 respondents (age, children, education, happiness, health, income, relationship status, religiosity). It is not paid client work.
What I did
Built frequency tables for each key question, turned them into the right chart for each type of data, and wrote a short plain-language interpretation under every chart.
- 1Checked the raw data and flagged missing answers instead of guessing them
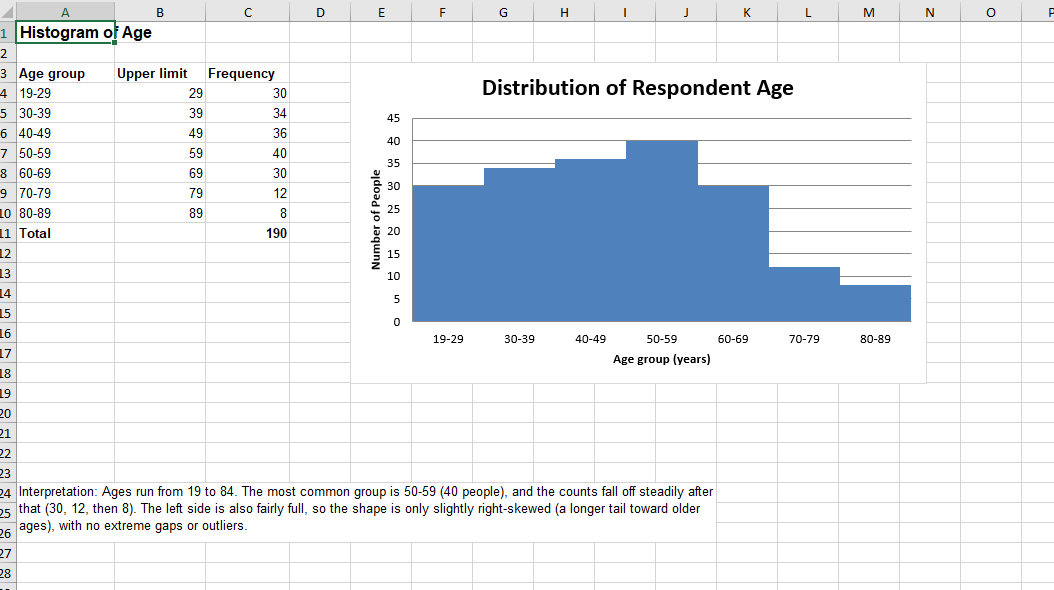
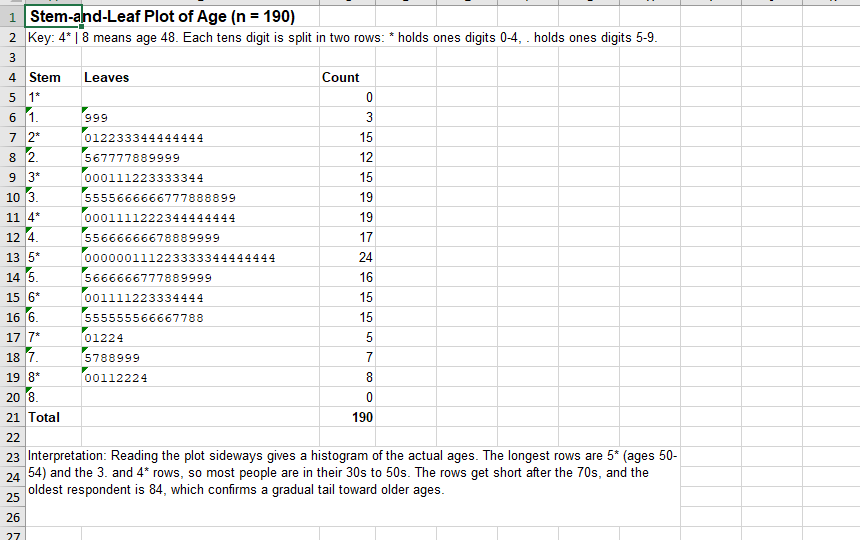
- 2Grouped ages into ten-year bands and counted every category
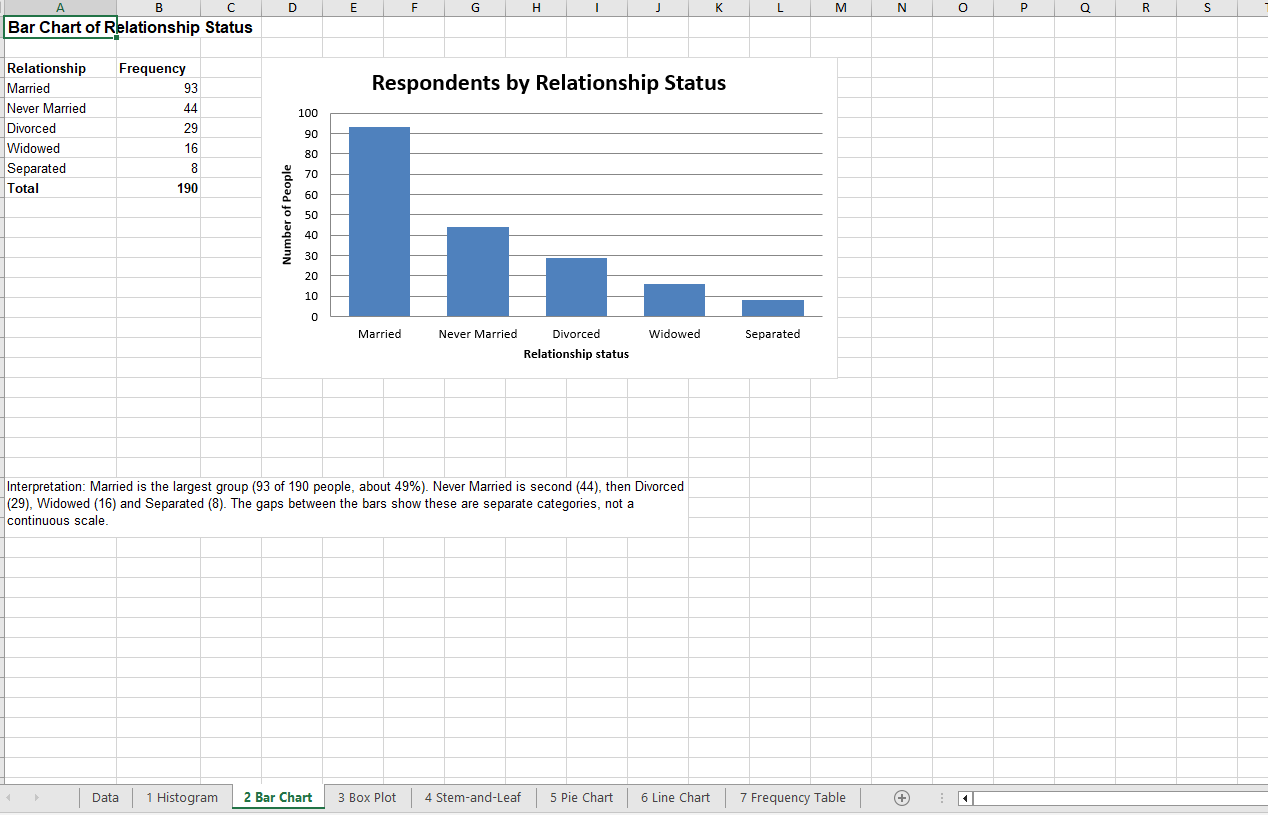
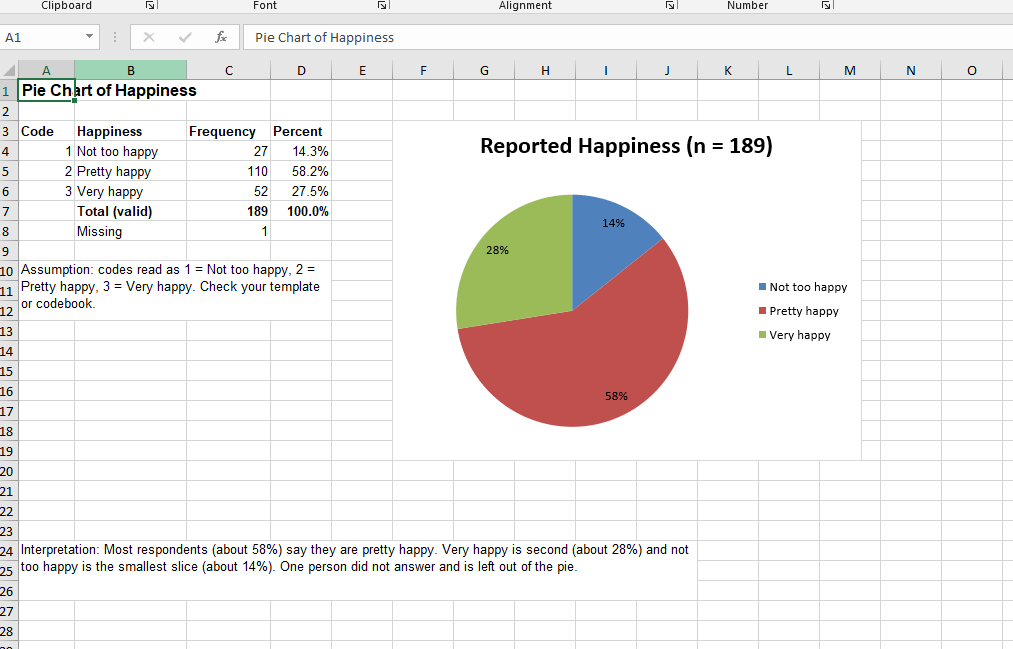
- 3Picked the right chart for each question (histogram for age, bar for relationship status, pie for happiness, line for education)
- 4Wrote a plain-language interpretation under each chart
The work

Key findings
- Married is the largest group: 93 of 190 people, about 49%
- About 58% of people who answered say they are pretty happy; 14% say not too happy
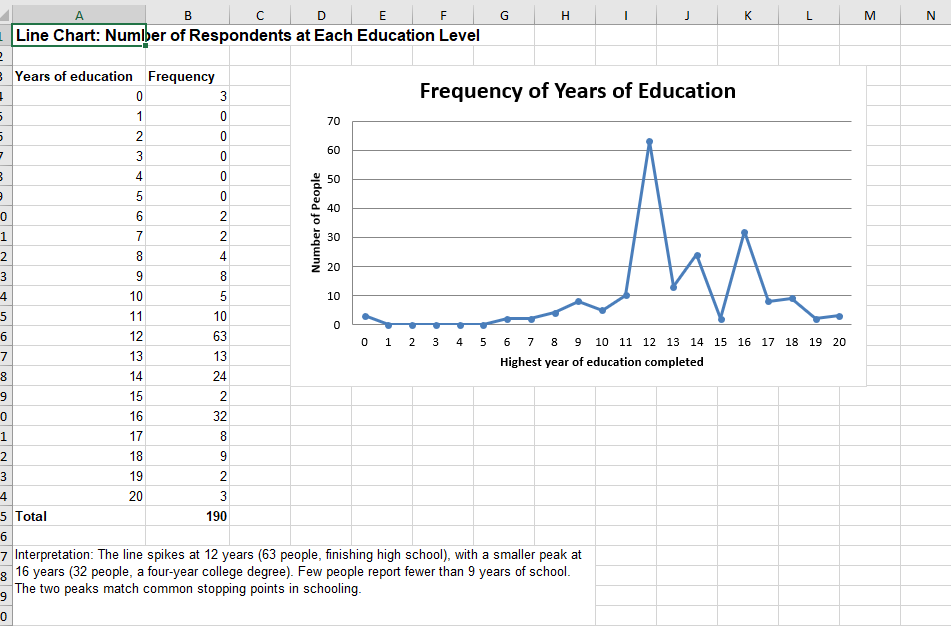
- Education peaks at 12 years (63 people) with a second peak at 16 years (32 people)
Tools
Excel
Delivered
Excel workbook with a data sheet and seven chart sheets
Result
Seven ready-to-read sheets: histogram, bar chart, box plot, stem-and-leaf plot, pie chart, line chart and frequency table, each with its own interpretation.